

But did you know you can also customize reports from your analytics dashboard, down to more minute details like post plays and impressions? If there are specific metrics you want to see and/or monitor constantly, you can simply add a new metric to your report in the form of a tile.
In this post, we will showcase how to add tiles to your Hootsuite analytics report. We will also briefly talk about more analytics stuff on Hootsuite, plus other tidbits of information that may be helpful to you. Let’s begin!

Key Takeaways
- To add a new tile to a Hootsuite report, simply click the plus (+) button and then select the type of metric you want to add.
- The answer to the question: “Within A Hootsuite Analytics Report, You Can Add A Tile, Which Is–” is an individual display of a specific metric.
- Hootsuite analytics helps you see crucial data about your brand’s performance across social media networks.

How Do I Add a Tile in Hootsuite Analytics Report?
Hootsuite’s Reports feature makes it easy for you to get an insight into how well your social media pages and posts perform. Whether you created a Report from a pre-built template, or customize one specifically for your brand, you may be wondering how to add a tile to your report.
Tiles are individual representations for a particular metric, such as post engagements and page likes. With each metric placed in one tile, viewing and organizing data is much more efficient.
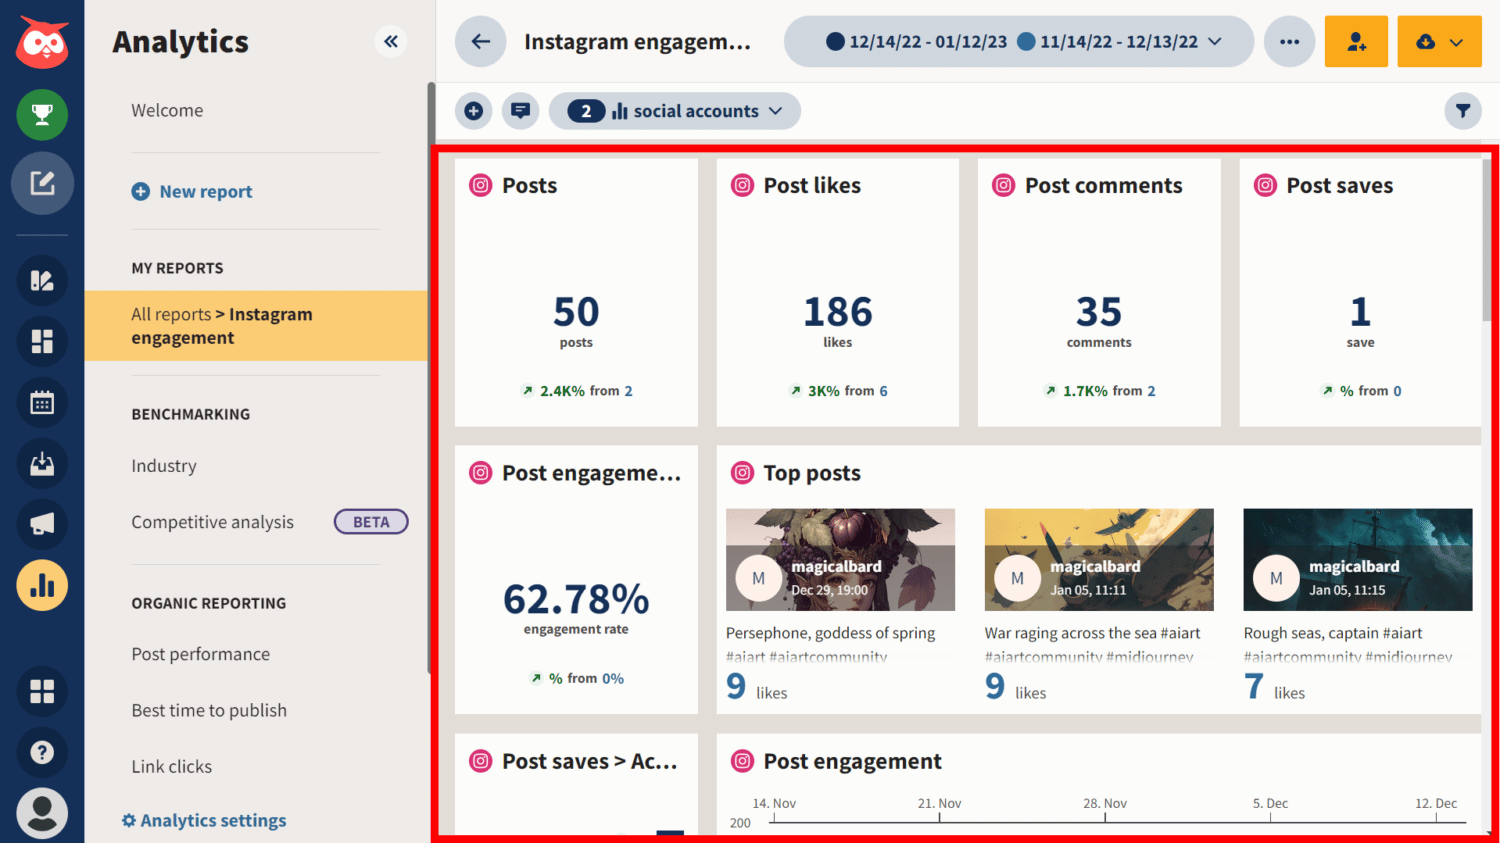
In other words, you can see information most relevant to you in a way you would prefer.
On Hootsuite, you can add tiles to your report individually. Here’s how you can do it:
-
Step 1

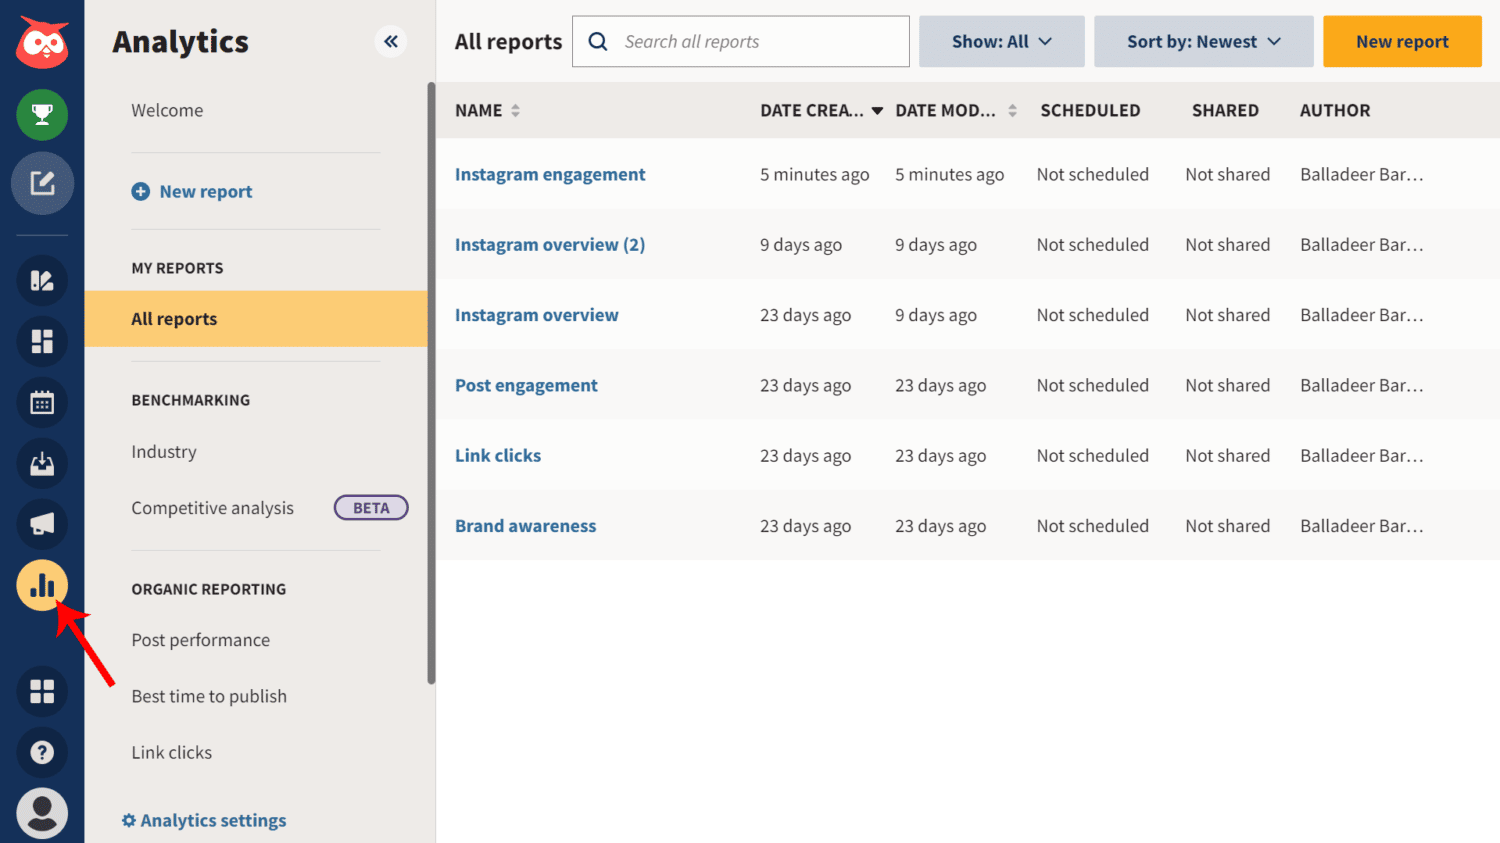
On your Hootsuite dashboard, go to the Analytics tab.
-
Step 2
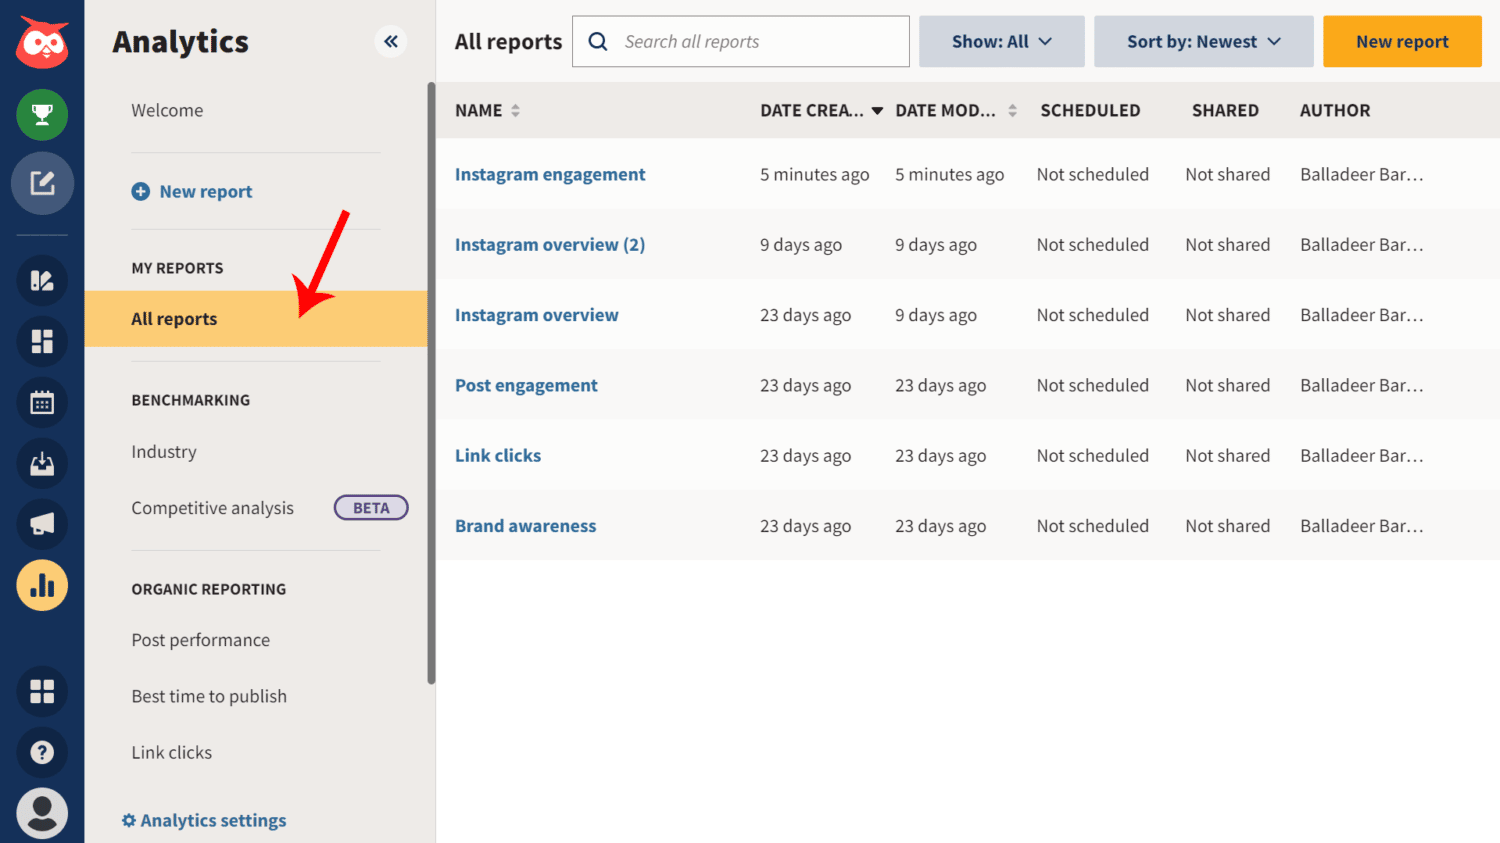
Go to “My Reports” > “All Reports”.
-
Step 3
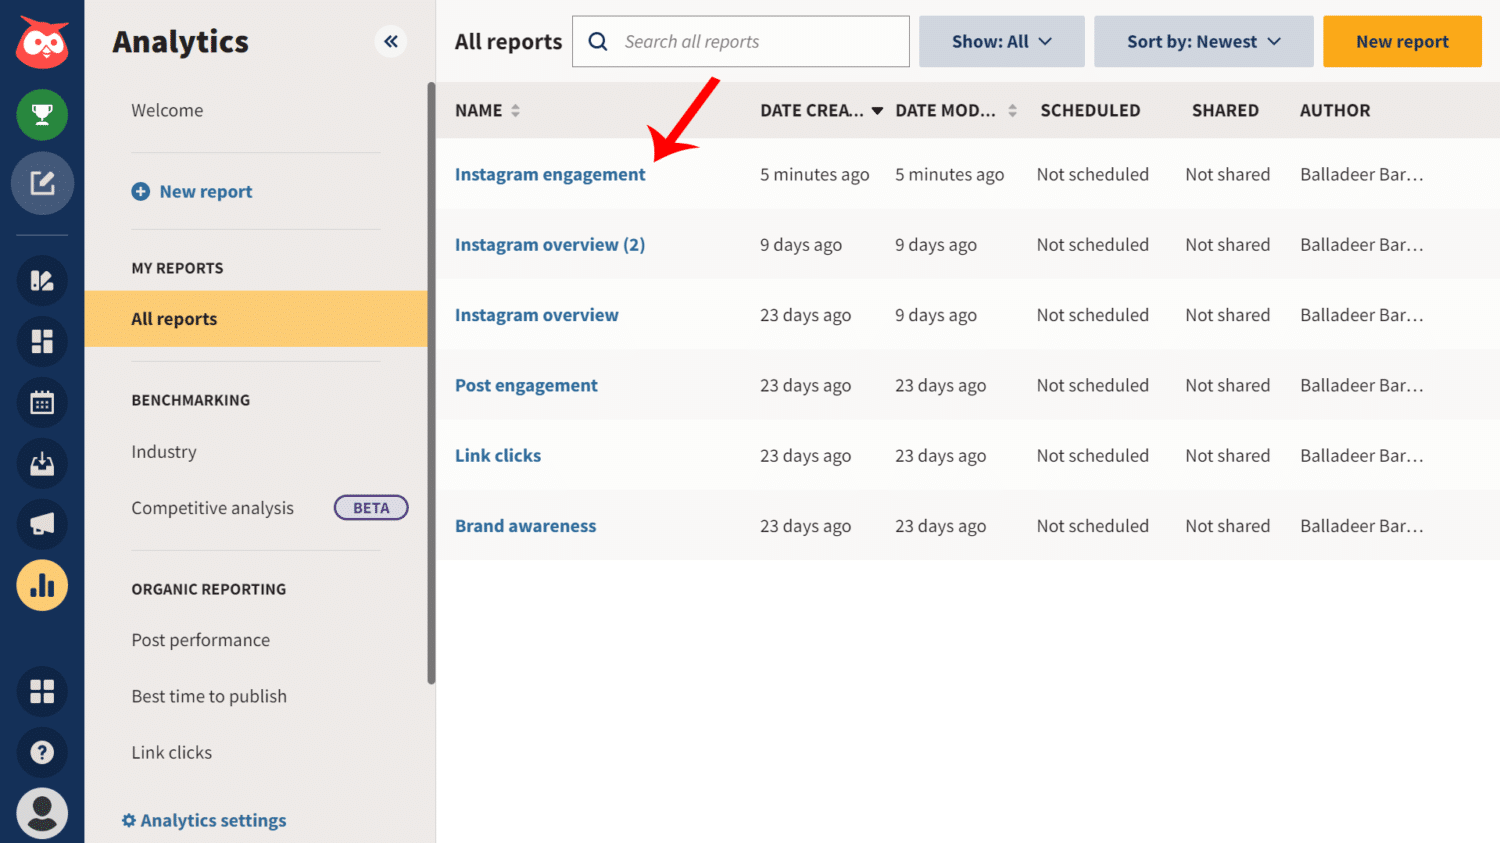
Select the report you want to add a tile in.
-
Step 4

Click the plus icon (+) to add a new metric tile.
-
Step 5

Select from the list of available metrics, then click “Add”.
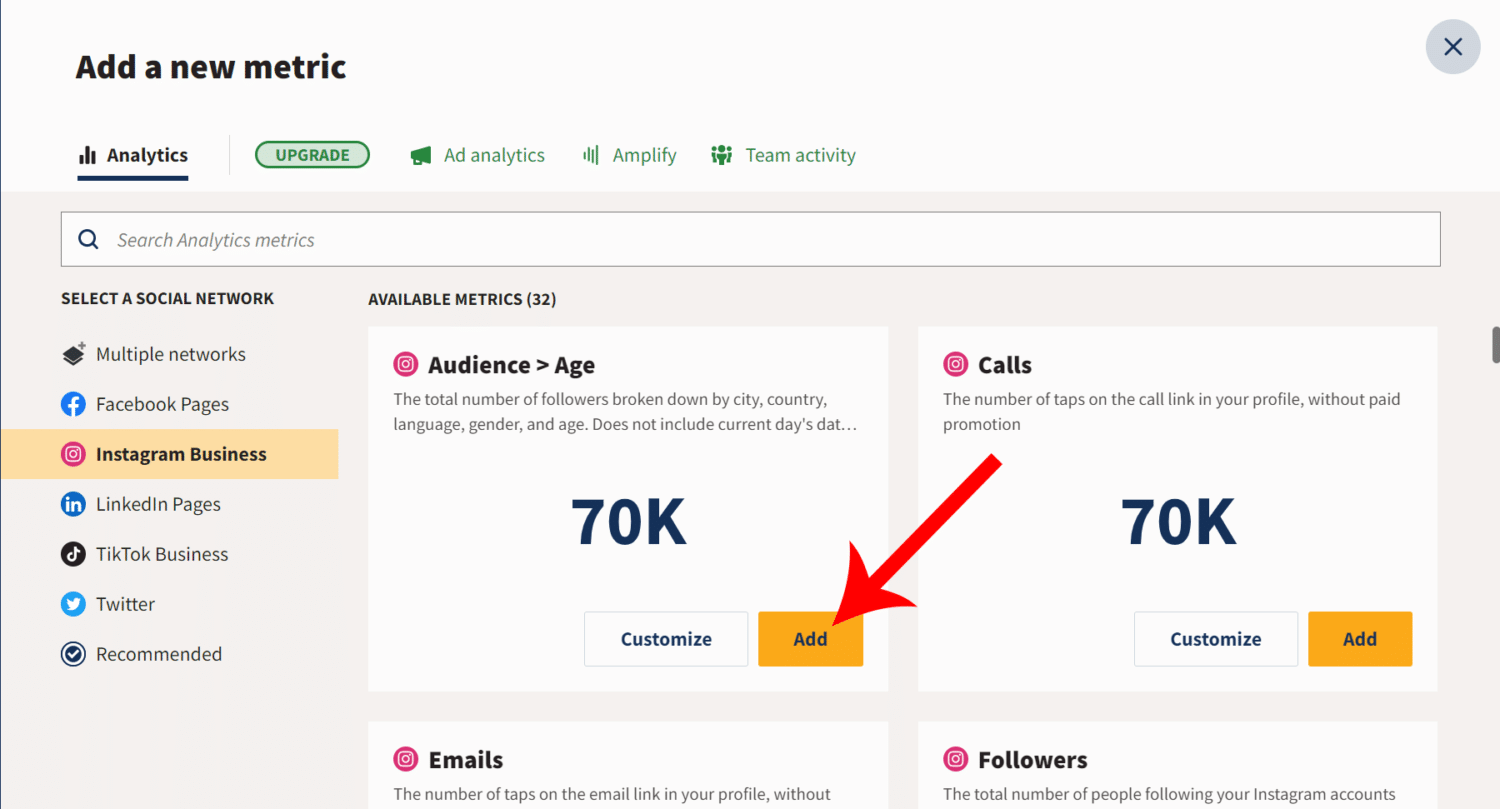
That’s it! The tile you selected has now been added to the report.

Brief Overview on Using Hootsuite Metrics and Tiles
If you are new to Hootsuite, you may still be trying to find your way around the platform, especially with its analytics feature. Hootsuite’s analytics tool is more robust and comprehensive than most social media management tools.
Thus, it’s a little bit more complicated compared to others, and it might take time for anyone to know their way around it. However, as soon as you get to know the basics, you will become an expert of using the tool before you know it.
What is Hootsuite Analytics Report?
Hootsuite Analytics Report is a collection of data gathered from all your connected social media accounts. It tracks and measures your brand’s performance across different social media platforms, all in one place. One of the best things about Hootsuite’s Analytics is how it’s possible to tailor it to suit to your needs.
On the “My Reports” section of the Analytics tool, you can create new reports from either existing presets or build a new one from scratch. Within these reports, you see metrics presented on separate tiles which you can move around the board, depending on which metric you’d like to see first (i.e., one more important to you).
Both types of reports allow you to edit them, including adding, editing, and deleting tiles. Once you add tiles, you can customize them. You can also do it on pre-existing ones.
Editing a Tile on Hootsuite Analytics
To edit a tile on a report, click on the gear icon at the corner of the tile you want to edit to customize tile.
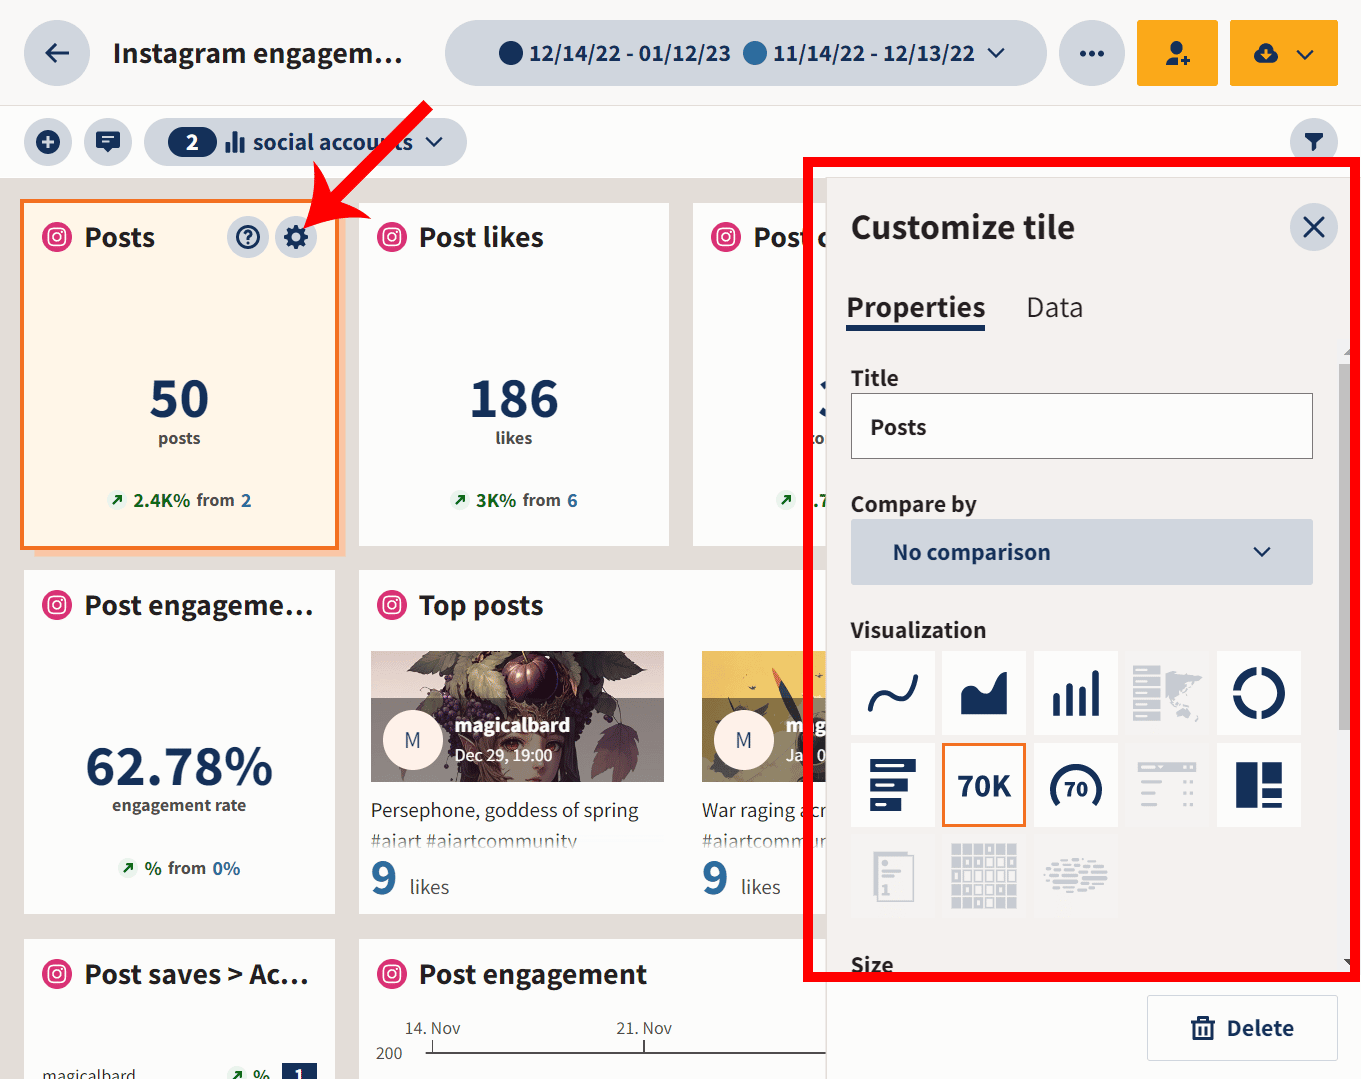
Then, edit it as you would. You can edit titles, visuals, and data sources among other things.
You can also drag the corners of the tile to make it smaller or larger.
Deleting a Tile in Hootsuite Analytics
To delete a tile on a report, just click on the gear icon to customize the tile.
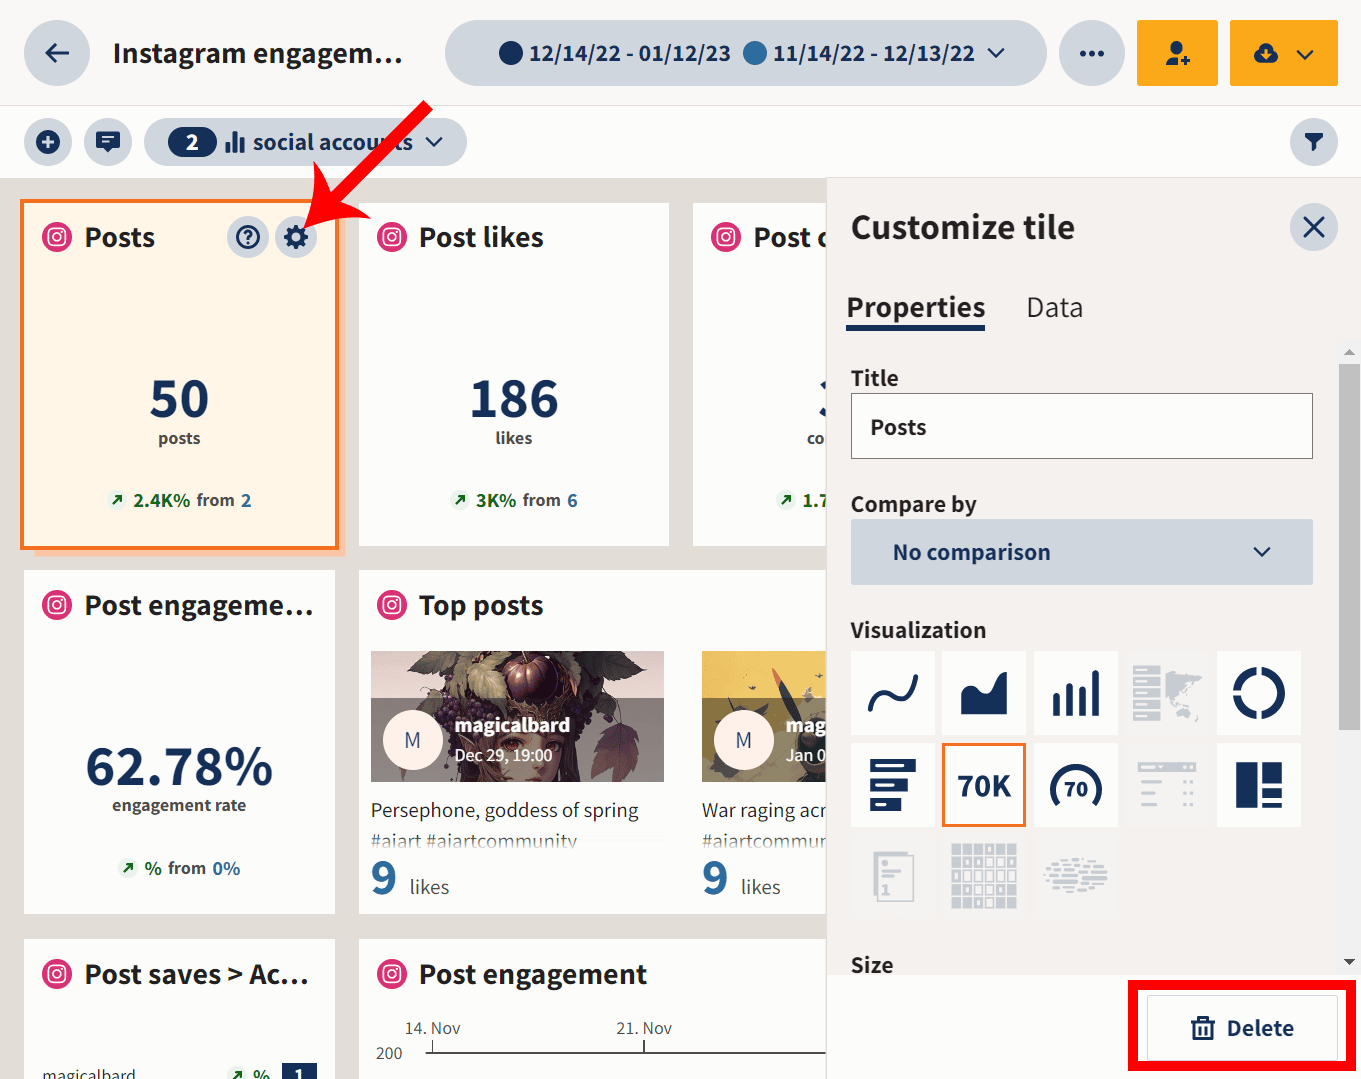
Then, click “Delete” on the customization menu.
What metrics does Hootsuite track?
Hootsuite tracks organic, owned, and earned metrics across various social media platforms. It shows you data like post engagement, likes, comments, saves, inbound messages, and more.
Hootsuite report measures both page-level metrics and post-level metrics on all of the social accounts you’ve integrated with the platform.

Correct answer to the question “Within A Hootsuite Analytics Report, You Can Add A Tile, Which Is–“
The Hootsuite Platform Certification exam allows you to get certified that you’ve mastered all of Hootsuite’s features. If you hadn’t heard about it yet, it’s a course you can take on the Hootsuite Academy.
The course comes with a 50-item exam that you can take once you’ve completed watching all the video tutorials.
Anyways, if you’ve taken it, you may have encountered this question in the exam:
“Within a Hootsuite Analytics report, you can add a tile, which is–?”
- a pre-set display of line charts, tables, and tree maps
- an individual display of a specific metric
- a pre-set campaign template, targeted at specific social media objectives
- an executive-level overview of common, aggregated metrics
- a tool for tracking the posts and conversations happening in your area
After reading this post, by now you may have known that the answer is “an individual display of a specific metric”.